Last updated on September 4th, 2023 at 09:49 pm
Here, We will learn about asymptotic analysis and notation, types of notation: big-o notation, omega notation, theta notation and growth rate of algorithm.
Asymptotic Analysis:
Asymptotic Analysis of an algorithm refers to computing the running time of any operation in mathematical units of computation.
It is not perfect, but best way available for analyzing algorithms.
Using asymptotic analysis, we conclude the algorithm in three types:
- Best Case – Minimum time required for program execution.
- Average Case – Average time required for program execution.
- Worst Case – Maximum time required for program execution.
Asymptotic Notation
Asymptotic Notation are used to represent the complexities of algorithms for asymptotic analysis.
It is a standardized way of measuring how much memory an algorithm uses or how long it runs for given input.
Following are commonly used asymptotic notation are :
- Big-O Notation
- Omega-Ω Notation
- Theta-Θ Notation
Big-O Notation :
Big-O Notation refers to the upper bound of time or space complexity of an algorithm. It measures the worse case time complexity.
Big-O of g(n), written as f(n) = O(g(n))

In the worst-case analysis, we calculate upper bound on running time of an algorithm.
Omega-Ω Notation :
Omega-Ω Notation refers to the lower bound of time or space complexity of an algorithm. It measures the best case time complexity.
Big-Omega of g(n), written as f(n) = Ω(g(n))

In the best-case analysis, we calculate lower bound on running time of an algorithm.
Theta-Θ Notation :
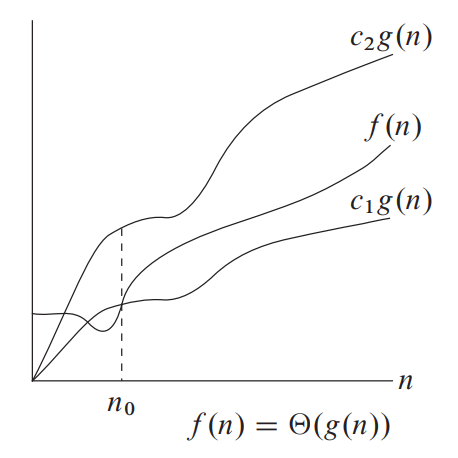
Theta-Θ Notation refers to the tight bound of time or space complexity of an algorithm. It expresses both the lower bound and upper bound of an algorithm’s running time.
Big-Theta of g(n), written as f(n) = Θ(g(n))

In average case analysis, we take all possible inputs and calculate computing time for all of its inputs.
Lower Bound <= Average Time <= Upper BoundGrowth Rate of Algorithm
Growth Rate of Algorithm is the rate at which the running time increases as a function of input.

log(n!) < (log(n))!
log(log*n) < log*(log n)
n < (log n)log n
2n < n! < nn
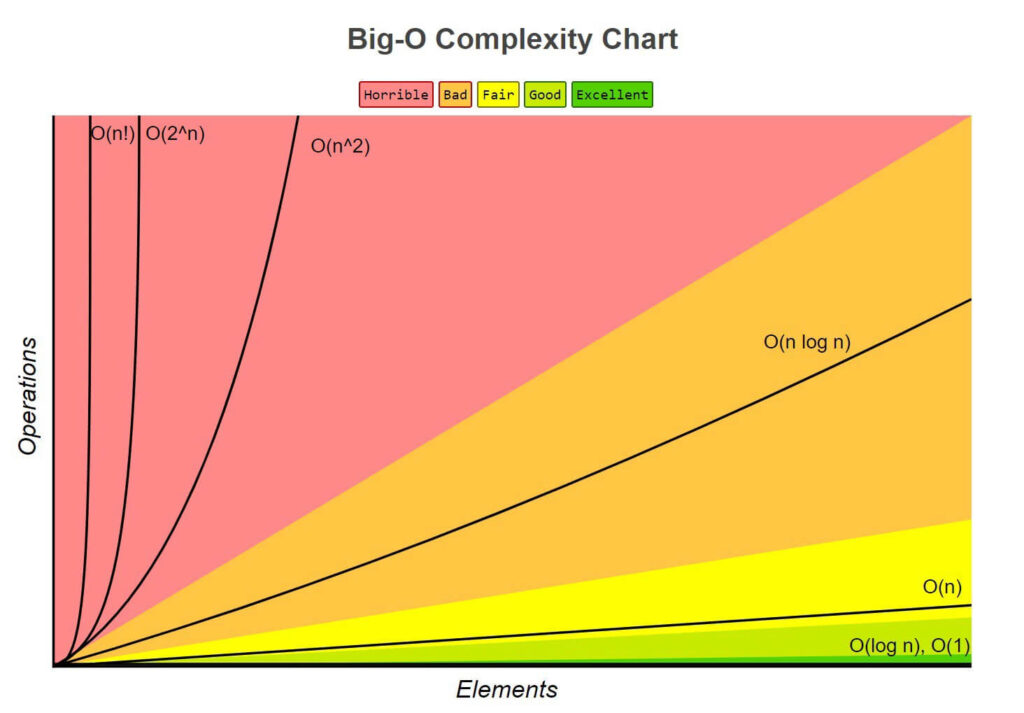
Here, list of growth rates are:
| Time Complexity | Name | Example |
| O(1) | Constant | Adding an element to the front of a linked list |
| O(log n) | Logarithmic | Finding an element in a sorted array |
| O(n) | Linear | Finding an element in an unsorted array |
| O(n log n) | Linear Logarithmic | Sorting n items by ‘divide-and-conquer’ |
| O(n2) | Quadratic | Shortest path between two nodes in a graph |
| O(n3) | Cubic | Matrix Multiplication |
| O(2n) | Exponential | The Tower of Hanoi |
Related:
Want to Contribute:-
If you like “To The Innovation” and want to contribute, you can mail your articles to 📧 contribute@totheinnovation.com. See your articles on the main page and help other coders.😎